Tracing - again!
Yes, I admit I already published a post about tracing Clojure code: APM with honeycomb.io in Clojure. I was not entirely happy with the solution I came up with, so I kept asking around, if and how other people traced Clojure applications. Luckily, in one of our monthly #clojure-germany calls, Ingo suggested I could do something like this with alter-var-root. And I did, here is the writeup.
The goal
I want the solution to trace every call of a function which is annotated with the metadata {:traced true}. The trace should contain the function name and the duration of the called function. I do not want to create traces with hierarchical spans, for now.
Setting up the Honeycomb client
This works just like the previous article, so I won’t explain this in detail:
(import '(io.honeycomb.libhoney LibHoney))

(defn init-honeycomb [{:keys [write-key dataset sample-rate]}]
  {:client (LibHoney/create (->
                    (LibHoney/options)
                    (.setWriteKey write-key)
                    (.setDataset dataset)
                    (.setSampleRate sample-rate)
                    (.build)))})

(def honey (init-honeycomb {:write-key "<SECRET_KEY>"
           	               :dataset "clj-mw-test"
             		            :sample-rate 2}))

(defn send-event [honey params]
  (-> (.createEvent (:client honey))
      (.addFields params)
      (.send)))
Finding all functions with the correct metadata
To automatically wrap the functions we want to trace, we first need to identify them. The function all-ns lists all namespaces available in our program. To list all the functions in a namespace, we can use the function ns-publics - which will return a map, containing the symbols as keys and the functions as values. For us, only the values are of interest. Finally, we can use the function meta to list all meta data which is present on an object. Tying all things together, we can build a function returning all the functions containing the metadata :traced true:
(defn find-traced-fn []
  (->>
   (all-ns)
   (mapcat ns-publics)
   (vals)
   (filter #(:traced (meta %)))))
Wrapping the functions with tracing logic
Now that we are able to identify all the functions we’d like to wrap, it is time to look closer at the function alter-var-root. On clojuredocs.org it is described as follows:
(alter-var-root v f & args)
Atomically alters the root binding of var v by applying f to its current value plus any args
This means we can apply a function f to v, which returns a new function, which wraps the original one. In this wrapper, we can trace the execution time, and send all the data we want to honeycomb. The code example looks like this:
(defn fqfn
  "Returns a fully qualified name for the function"
  [function]
  (let [m (meta function)]
    (str (:ns m) "/" (:name m))))

(defn wrap-fn
  "If applied to a function, it gets wrapped with the Honeycomb tracing"
  [function]
  (alter-var-root
   function
   (fn [f]
     (fn [& n]
       (let [start (System/currentTimeMillis)
             result (apply f n)
             duration (- (System/currentTimeMillis) start)]
         (send-event honey {"name" (fqfn function)
                            "duration_ms" duration})
         result)))))
One important point to highlight is, that the wrapper function accepts variable args, so that it will be able to wrap functions with variable argument length, too, and call it correctly with (apply f n), later. This code will send the duration and the name of the function to Honeycomb, no matter where the function got called from.
Testing the code
Finally, let’s see how everything works. We quickly set up three functions to test our logic. The functions plus and example should be traced, the function minus should not. The example function also lets the thread sleep for some time, so we can see actually traced time:
(defn plus {:traced true} [a b]
  (+ a b))

(defn minus [a b]
  (- a b))

(defn example {:traced true} [duration]
  (Thread/sleep duration)
  (plus 10 (minus 5 3)))

; Wrap the functions in our tracing function
(map wrap-fn (find-traced-fn))

; Call the example function several times with increasing duration
(map example (range 1 1000 100))
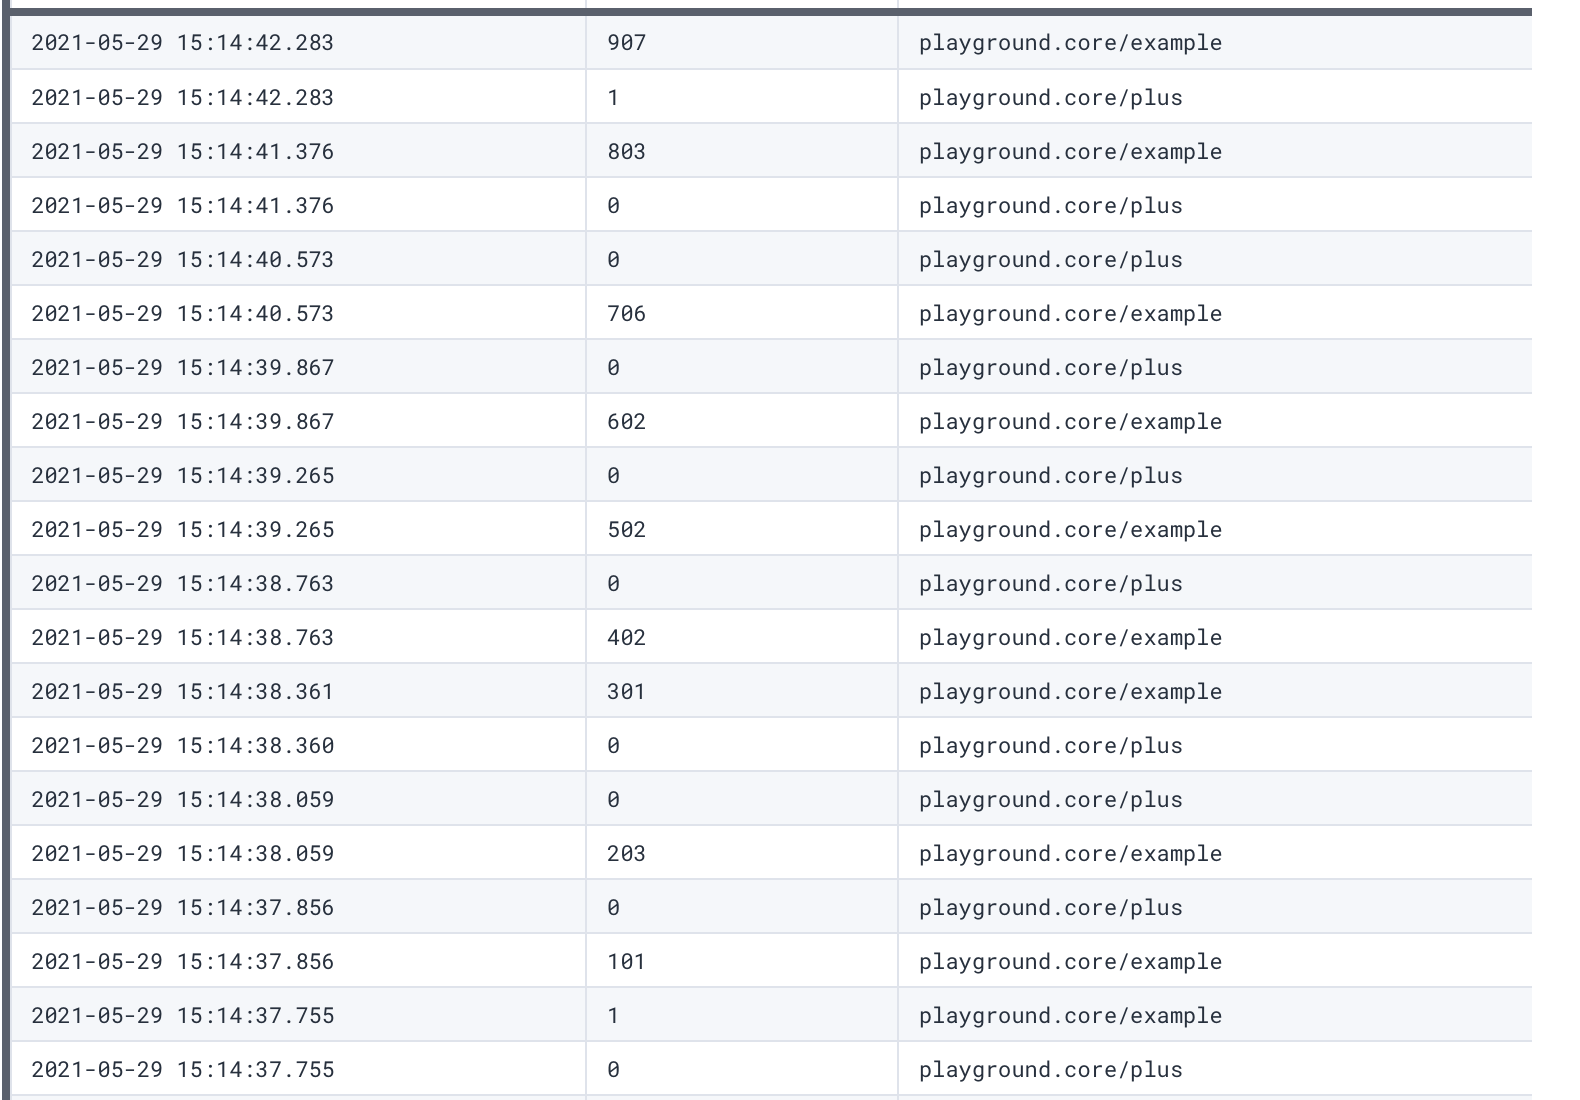
It worked! We see the example function and the plus function in honeycomb, but not the minus function:
What next?
In the next steps, I’d like for the solution to support nested traces and spans, so we are able to trace everything from one parent call together. I will probably try and add the necessary information to the wrapped function as the last, optional parameter, but this will be a little bit more tricky when using functions with variable parameter lists. For now, the goal was met in a way I like way better than the old solution I came up with.